The 2024 U.S. Presidential Election is shaping up to be one of the closest in modern history. On one side, we have Vice President Kamala Harris, hoping to continue the current administration’s momentum. On the other, former President Donald Trump seeks a historic return to the Oval Office. With polls and forecasts indicating a razor-thin margin between the two candidates, we’re entering unpredictable territory.
Could a single state swing the entire election? Or, as in past elections, might a combination of unexpected wins lead to a shocking result? Using historical data and current polling, we have mapped out three fascinating scenarios that highlight just how much of a nail-biter this race could become. In each case, just a handful of states could mean victory, defeat, or a rare tie.
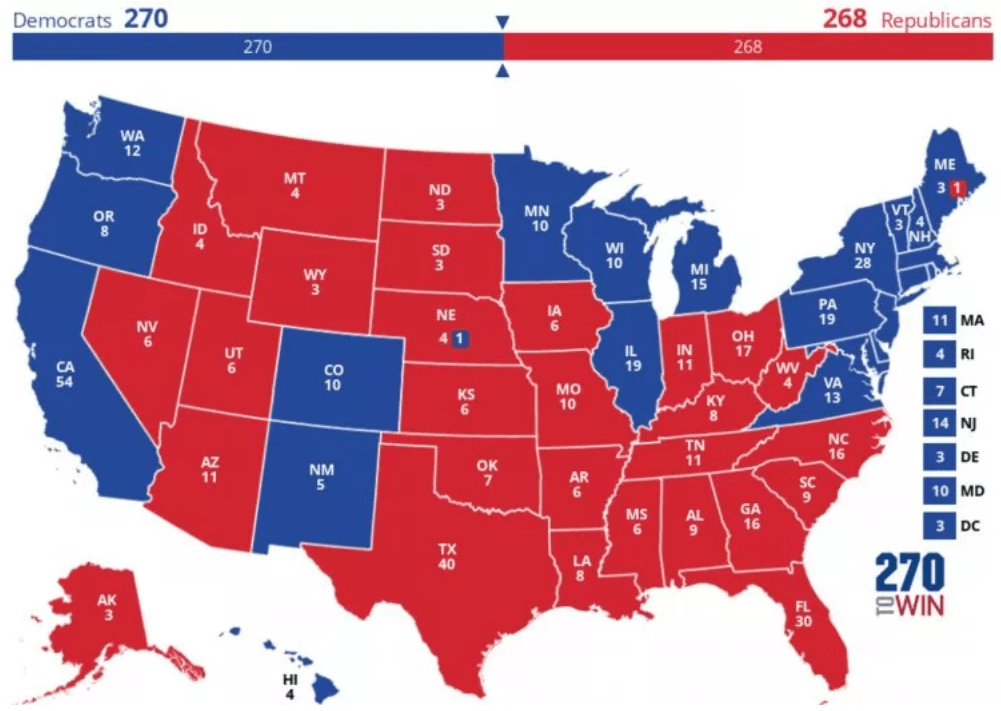
Let’s dive into these scenarios, each showing a different path to the White House. For easiness we use the below as base for scenarios as it is closer to 50:50
Scenario 1: Trump Flips the Rust Belt
In this first scenario, Trump’s campaign makes a comeback in the Midwest, flipping the critical swing states of Wisconsin and Pennsylvania. Historically, these states have been battlegrounds, swaying back and forth between parties. In recent years, both have leaned slightly Democratic, but with close margins.
Key States Flipped: Wisconsin (10 electoral votes) and Pennsylvania (19 electoral votes)
Electoral Vote Outcome:
- Trump: 297 electoral votes
- Harris: 241 electoral votes
If Trump can secure Wisconsin and Pennsylvania, he could edge out a victory. Polls show Harris with a slight lead in these states, but any shift in voter sentiment or turnout could easily change that. With strong rural support and a strategic focus on the economy and manufacturing, Trump could flip these states. This scenario is a classic path for Republicans, capitalizing on economic concerns in regions with a high concentration of blue-collar voters.
Result: Trump wins the election
Scenario 2: Harris Expands Her Base in the South
In this scenario, Harris successfully capitalizes on changing demographics and urban growth in two traditionally red states: Arizona and Georgia. Both states have become more competitive in recent years due to urban expansion, increased diversity, and a growing number of younger voters.
Key States Flipped: Arizona (11 electoral votes) and Georgia (16 electoral votes)
Electoral Vote Outcome:
- Harris: 297 electoral votes
- Trump: 241 electoral votes
If Harris can lock down Arizona and Georgia, she’ll be on track for a comfortable victory. This scenario relies on strong voter turnout in urban centers like Phoenix and Atlanta, where Democrats have built momentum. Harris’s campaign could focus on issues important to younger, more diverse populations in these areas, such as climate change, healthcare, and educational access. This would mark a historic shift in U.S. politics, with two reliably red states moving toward the Democratic column.
Result: Harris wins the election
Scenario 3: A 269-269 Tie: A Constitutional Thriller
In this unusual and rare scenario, the election ends in a tie — 269 electoral votes for each candidate. This scenario involves Trump flipping Wisconsin, while Harris narrowly loses Nevada. With these shifts, neither candidate reaches the 270 votes needed for an outright win, creating a unique constitutional situation.
Key States Flipped: Wisconsin (10 electoral votes) and Nevada (6 electoral votes)
Electoral Vote Outcome:
- Harris: 269 electoral votes
- Trump: 269 electoral votes
A 269-269 tie would mean the election is sent to the House of Representatives, where each state delegation casts one vote to decide the presidency. This would be only the second time in U.S. history that the House has determined the election, the first being in 1824. In such a case, the winner would depend on the political makeup of state delegations, leading to intense lobbying, potential party shifts, and high-stakes negotiations.
Result: Tied election, decided by the House of Representatives

Conclusion
Each of these scenarios showcases the power of just a few battleground states and the unpredictable nature of U.S. presidential elections. As we inch closer to election day, all eyes will be on swing states like Wisconsin, Pennsylvania, Arizona, Georgia, and Nevada, where even a slight shift in voting patterns could mean the difference between victory and defeat.
The 2024 election may come down to the wire, leaving both campaigns scrambling for every last vote in crucial battlegrounds. Whether it ends in a decisive win or a nail-biting tie, one thing is clear: this election will be one for the history books.
What’s your prediction? Let us know in the comments if you think any of these scenarios might come true, or if you have another theory about what could unfold!
Reference : The last 50 years of U.S. presidential election results
| Year | Winner | Party | Electoral Votes | Popular Vote (%) | Opponent | Opponent Party | Opponent Electoral Votes | Opponent Popular Vote (%) | Third-Party Candidates |
|---|
| 1972 | Richard Nixon | Republican | 520 | 60.7 | George McGovern | Democratic | 17 | 37.5 | – |
| 1976 | Jimmy Carter | Democratic | 297 | 50.0 | Gerald Ford | Republican | 240 | 48.0 | – |
| 1980 | Ronald Reagan | Republican | 489 | 50.4 | Jimmy Carter | Democratic | 49 | 41.0 | John Anderson (Independent, 6.6%) |
| 1984 | Ronald Reagan | Republican | 525 | 58.8 | Walter Mondale | Democratic | 13 | 40.6 | – |
| 1988 | George H.W. Bush | Republican | 426 | 53.4 | Michael Dukakis | Democratic | 111 | 45.7 | – |
| 1992 | Bill Clinton | Democratic | 370 | 43.0 | George H.W. Bush | Republican | 168 | 37.4 | Ross Perot (Independent, 18.9%) |
| 1996 | Bill Clinton | Democratic | 379 | 49.2 | Bob Dole | Republican | 159 | 40.7 | Ross Perot (Reform, 8.4%) |
| 2000 | George W. Bush | Republican | 271 | 47.9 | Al Gore | Democratic | 266 | 48.4 | Ralph Nader (Green, 2.7%) |
| 2004 | George W. Bush | Republican | 286 | 50.7 | John Kerry | Democratic | 251 | 48.3 | – |
| 2008 | Barack Obama | Democratic | 365 | 52.9 | John McCain | Republican | 173 | 45.7 | – |
| 2012 | Barack Obama | Democratic | 332 | 51.1 | Mitt Romney | Republican | 206 | 47.2 | – |
| 2016 | Donald Trump | Republican | 304 | 46.1 | Hillary Clinton | Democratic | 227 | 48.2 | – |
| 2020 | Joe Biden | Democratic | 306 | 51.3 | Donald Trump | Republican | 232 | 46.8 | – |


